Table of contents
The key to a profitable stock market journey is the knowledge and ability to understand the trends and patterns of stocks to formulate strategies accordingly. Identifying and analysing early trends and patterns allow traders to make appropriate entry and exit decisions to maximise profits and minimise losses.
One such pattern is the swing failure, which helps technical analysts identify potential market trends. In today’s blog, let us understand how the swing failure pattern works and what it indicates.
What is a swing failure pattern?
A swing failure or a failure swing pattern is a leading indicator in technical analysis that suggests a potential reversal in the existing trend. Swing failure works with the Relative Strength Index (RSI) to warn traders of possible reversals in an uptrend or a downtrend market.
Before we delve into the details of the pattern, let’s go through the components that make up the swing failure.
The components of a swing failure pattern
- RSI
RSI stands for Relative Strength Index. It is a momentum indicator that suggests the strength of a trend. Traders observe stock prices for 14 days, based on which they calculate an RSI value between 0 and 100. A value of 0 suggests a strong downtrend, and a value of 100 suggests a strong uptrend.
- Divergence
Generally, when the trend is strong, the RSI and the stock price move together. As the price increases, the RSI increases, too, showing the strength of the uptrend and vice versa.
However, when the trend is weak, the price and RSI do not move together in the same momentum, indicating a divergence between the two.
- Swing high and low
A swing high is where the stock reaches a high above all of its previous highs. A swing low is where the stock reaches a low below all of its previous lows.
How does the swing failure work?
While analysing stock market trends is essential, analysing the strength of such trends is equally critical. Making decisions on a weak trend can lead to unexpected losses. So, indicators like RSI play a crucial role here.
During the 14 days for calculating the RSI, if the price constantly rises, the RSI rises, too, suggesting a healthy momentum in the uptrend. Similarly, if the price continuously falls, the RSI falls, too, indicating a strong downtrend.
However, due to uncertainties and volatility in the stock market, the price does not always move in the same direction. They are prone to reverse at some point, but before the reversal occurs, the momentum of the existing trend slows down. That is where a swing failure happens. So, when the price continues to fall, making lower lows, the RSI falls, too, but instead of lower lows, it makes higher lows. Similarly, when the price continues to rise, making higher highs, the RSI rises, too, but makes lower highs.
Swing failure types
There are two types of swing failures – the bearish failure swing and the bullish failure swing.
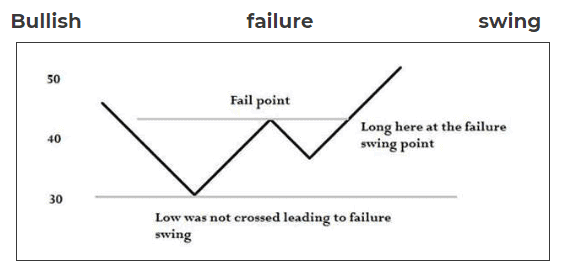
In a bullish swing failure or bottom failure swing, the price reaches lower lows, but the RSI reaches higher lows. It creates a positive divergence and suggests a bullish reversal, where the downtrend may end and the uptrend may begin.
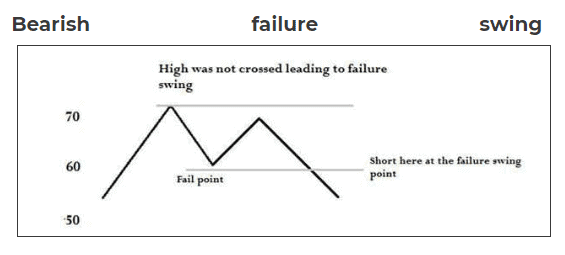
In a bearish failure swing or top failure swing, the price reaches higher highs, but the RSI reaches lower highs. It leads to a negative divergence, hinting at a bearish reversal, where the uptrend might end and the downtrend might begin.
Trading strategies
One of the main benefits of the failure swing indicator is its ability to give early signals of potential reversals. So, when traders notice a failure swing in an uptrend, they exit, and in a downtrend, they enter. This helps them make profits or restrict losses when the trend reverses.
Bottomline
The relative strength index is widely used among technical analysts since it suggests the momentum of trends, which helps make accurate decisions. Besides indicating strength, RSI also hints at a trend’s weakness when the price and RSI line diverge.
Such divergence is an indication of a potential reversal of an existing trend, that helps traders take early positions and profit accordingly. Hence, understanding the concept of failure swing patterns is essential, especially for technical traders, to ensure no opportunity to take positions is missed.
FAQs
An RSI value below 30 suggests that the security is undervalued, which means there is a possible correction in the future where the price will rise. So, when the RSI is below 30, it is considered a signal to buy, so that traders can profit during market correction.
An RSI value above 70, on the other hand, suggests that the security is overvalued and is a signal to sell.
A failure swing is a phenomenon where the RSI line and the price line do not move in the same momentum, despite moving in the same direction. Hence, it indicates a dip in the momentum, hinting at a potential reversal.
A failure swing below 30 or above 70 is considered a very strong indication of reversals in stock market trends.
Welles Wilder Jr. introduced the concept of failure swing pattern, in his book ‘New Concepts in Technical Trading Systems’. He also spoke about failure swings above 70 and below 30 being very strong reversal indicators, in the same book.
Though a mechanical engineer and a real estate developer, Wilder is well-known for his work in the technical analysis of stocks.
Divergence can be both bullish and bearish. It depends on when the divergence is occurring.
A divergence in the stock market is where the price does not move as predicted by the technical indicator. In this case, the divergence is bullish when the price hits a new low, but the RSI hits a higher low. The divergence is bearish when the price hits a new high, but the RSI hits a lower high.
There are various technical indicators suggesting trend reversals in the stock market.
Some widely used indicators are the Relative Strength Index (RSI) and failure swing pattern, Moving Averages Convergence/Divergence (MACD), Bollinger Bands, etc.