Table of contents
Are you a beginner trader who finds it tricky to understand the cryptic shapes and colours in the candlestick charts? Well, learning to read candlesticks can be a game-changer for your technical analysis skills. It will help you visualise price data, spot trends, and make smarter trades.
White candlestick holds a special significance as an indicator of bullish sentiment. In this article, we will give you a primer for decoding candlestick charts, focusing on understanding the meaning of the white candlestick. You will learn what candlesticks represent, the significance of white candlesticks, common candlestick patterns, and how to harness candlesticks in trade decisions.
What do candlesticks represent?
A candlestick is a helpful tool that shows how much a stock’s price has gone up or down over a day of trading. It is like a little picture that gives you a quick and simple way to see what happened in the stock market that day.
It shows you the highest and lowest price that the stock reached during that time so you can get a good idea of how the market is doing:
- Open: The starting price at the beginning of the timeframe
- High: The peak price recorded during the timeframe
- Low: The lowest dip in price during the timeframe
- Close: The final price at the end of the timeframe
- Body: The thick middle part of the candlestick between the open and close
- Shadows/Wicks: The thin lines above and below the body represent the high and low
Hence, candlesticks provide an easy visual representation of the entire price range over a particular period. Additionally, candlesticks incorporate the closing price of the previous timeframe. This allows traders to easily view how current sentiment compares historically.
The candlestick’s central rectangle or ‘body’ visualises the range between the open and close. When the body colour is white or green, it signals the close was higher than the open. The lines above and below the body represent the high and low, respectively. These components offer a snapshot of the security’s price fluctuation within the set period.
The significance of white candlesticks
In candlestick charting, the colour of the central body conveys key insights. The default scheme:
- White or green body = The close was higher than the open (bullish)
- Black or red body = The close was lower than the open (bearish)
Thus, a white or green candlestick indicates that buying pressure pushed the security price higher by closing the trade. This paints an optimistic picture of market sentiment. Some charting systems allow custom colours, but white and green typically signal an upward price trajectory.
The longer the white candlestick’s body size, the more intense the buying momentum. A long white candlestick shows strong optimism dominant among market participants, suggesting potential for further upside.
Conversely, a black or red candlestick shows selling pressure, forcing the security price to be lower by the end of the period. The longer the candlestick’s body size, the more intense the bearish sentiment.
What do white candlesticks indicate?
White candlesticks come into play when:
- Closing price > Opening price
If the closing price finishes above the opening price, the body is filled either white or green, depending on the charting platform.
This conveys the bulls remained in control through the session and pushed prices higher by the close. It represents rising optimism and demand during that timeframe.
- The psychology behind white candlesticks
If a white candlestick emerges:
- Buyers come in aggressively right from the open and maintain control through the close, not allowing bears to push prices down.
- Bulls absorbed all the selling pressure and overpowered bearish traders by the end of the session.
- Market participants expect higher prices ahead and the uptrend to continue.
- New long positions are being built while traders exit short positions anticipating rising prices.
- The interplay between buyers and sellers explains the colour of the candlestick. Evidently, white candlesticks require the bullish camp to dominate proceedings.
Harnessing candlestick patterns
Skilled chart readers can identify recurring candlestick patterns that suggest potential opportunities. Here are three notable examples:
1. Bullish abandoned baby
This reversal pattern signals a potential upside breakout. It starts with a black candlestick, followed by a doji below the prior close. Finally, a white candlestick gaps above the doji open/close. The buy signal is stronger when volume escalates on the third white candlestick.
2. Bearish abandoned baby
The inverse of the above bullish pattern signals potential trouble ahead. It comprises a white candlestick, a doji above the previous close, and black candlestick gaps below the dojo’s open/close level. Rising volume adds confidence to the sell signal.
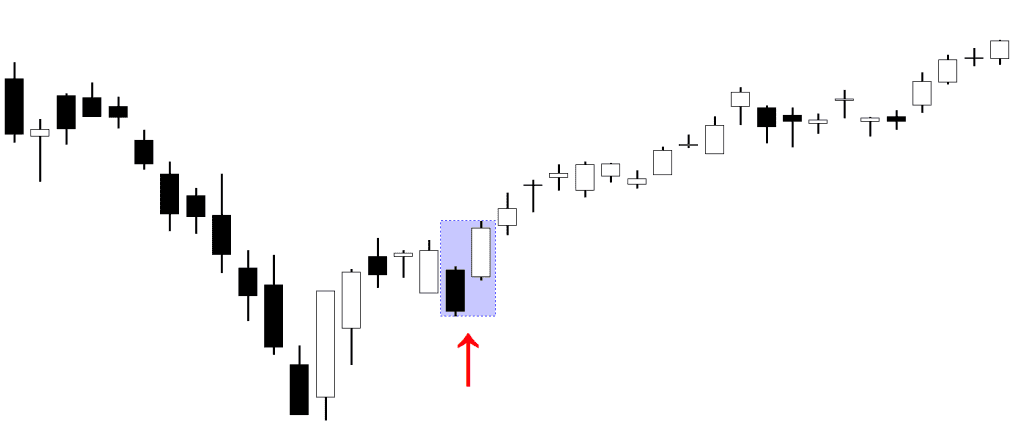
3. Morning/evening stars
These star patterns comprise a short candlestick sandwiched between longer bodies resembling stars. The ‘morning star’ gap hints at changing sentiment from bearish to bullish; vice versa for the ‘evening star‘. These can prompt savvy traders to enter/exit positions accordingly.
Incorporating candlestick analysis into your trading plan
The colourful imagery of candlestick charts allows traders to form an at-a-glance narrative of market psychology during key periods. While raw price levels convey vital data, candlesticks transform numbers into intuitive stories.
A succession of long white candlesticks depicts surging optimism and buying frenzy, for example. Skilful chart readers can match candlestick signals with complementary indicators to confirm emerging trends and forecast potential reversals.
When beginning to utilise candlestick patterns, it helps to start with the most simple and reliable formations. The long white candlestick itself frequently highlights the dominance of bullish sentiment. Triangulating its signals with other indicators helps novice technicians hone chart reading skills. Over time, traders can move on to filtering more nuanced and intricate candlestick combinations for trade signals.
As with any analytical approach, candlestick charting should be followed with context. Still, marrying its visual signals with insights from momentum oscillators, volume shifts, and moving average dynamics can produce a robust trading system.
In this manner, unlocking the colour-coded clues implanted within candlestick patterns allows traders to form quick assessments of market conditions for improved decision-making. With practice, candlesticks emerge as a valuable weapon in the savvy trader’s arsenal.
Candlesticks vs. Bar Charts – Key Differences and Uses
Both candlestick charts and bar charts are essential tools in technical analysis — but they differ in how they present price data and the clarity they offer to traders.
Here’s a breakdown of their key differences and when to use each:
Visual Structure
| Element | Candlestick Chart | Bar Chart |
|---|---|---|
| Appearance | Rectangular body with wicks (shadows) | Vertical line with left & right tick marks |
| Color Coding | Uses color (e.g., white/green for bullish) | Less visual, mostly monochrome |
| Readability | Visually intuitive and beginner-friendly | Requires more effort to interpret |
Interpretation of Trends
- Candlesticks instantly show whether the market was bullish or bearish during a specific time frame.
- Bar charts also offer the same information but in a less obvious way, especially for beginners.
For example, a white candlestick clearly shows the closing price was higher than the opening, signaling bullish sentiment — whereas a bar chart requires identifying ticks on both sides to conclude that.
Best Use Cases
| Use Case | Best Chart Type | Why? |
|---|---|---|
| Spotting trend reversals | Candlestick Chart | Clear patterns like doji, hammer, engulfing |
| Analyzing pure price movement | Bar Chart | Minimal distraction, focus on price points |
| Educational purposes | Candlestick Chart | Easier for learners to spot bullish/bearish moves |
| Professional charting systems | Both | Depends on preference and strategy |
Conclusion
The humble white candlestick holds sway over market psychology and provides invaluable insights into evolving price dynamics. White candles encapsulate the unbridled optimism markets feel when greeting favourable data or developments.
Their addition to established chart patterns boosts the robustness of predictive signals regarding potential bullish reversals. Acquiring competency in combining candlestick analysis with other technical tools forms a vital skill for astute traders.
FAQs
The colours denote the relationship between the opening and closing prices over the specified timeframe. White or green means the close was higher than the open, signalling bullish optimism. Black or red means the close was lower, indicating bearish pessimism during that period.
The larger the white candlestick’s body size, the more intense the upward momentum. Long white candles show strong buying pressure was dominant, so they often highlight opportunities to traders as signals of potential for further upside ahead.
Doji candlesticks have nearly equal open and close prices, depicting market indecision. Their emergence in formations like the abandoned baby patterns forewarn of potential reversals ahead as sentiment may be shifting at turning points.
Smart traders look to match reliable candlestick signals with other indicators to confirm emerging trends or forecast upcoming reversals. Using candlestick signals with care and context allows informed trade planning.
While valuable for visualising sentiment, candlestick patterns should not be followed blindly. By combining insights with volume, momentum indicators and other tools, traders can make better-informed decisions.